Get exclusive access to our latest updates
By submitting your info, you agree to opt-in to emails from ChartHop.
Easily analyze all your people data.
Build and share real-time reports that aggregate all your HR data in one place.

HR Analytics and Insights, no PhD needed

Analyze DEI metrics, turnover, flight risk, and more
Measure organizational health through easy-to-build reports

Measure data across all your people systems
Analyze your HR data from your HRIS, ATS, equity system, and more

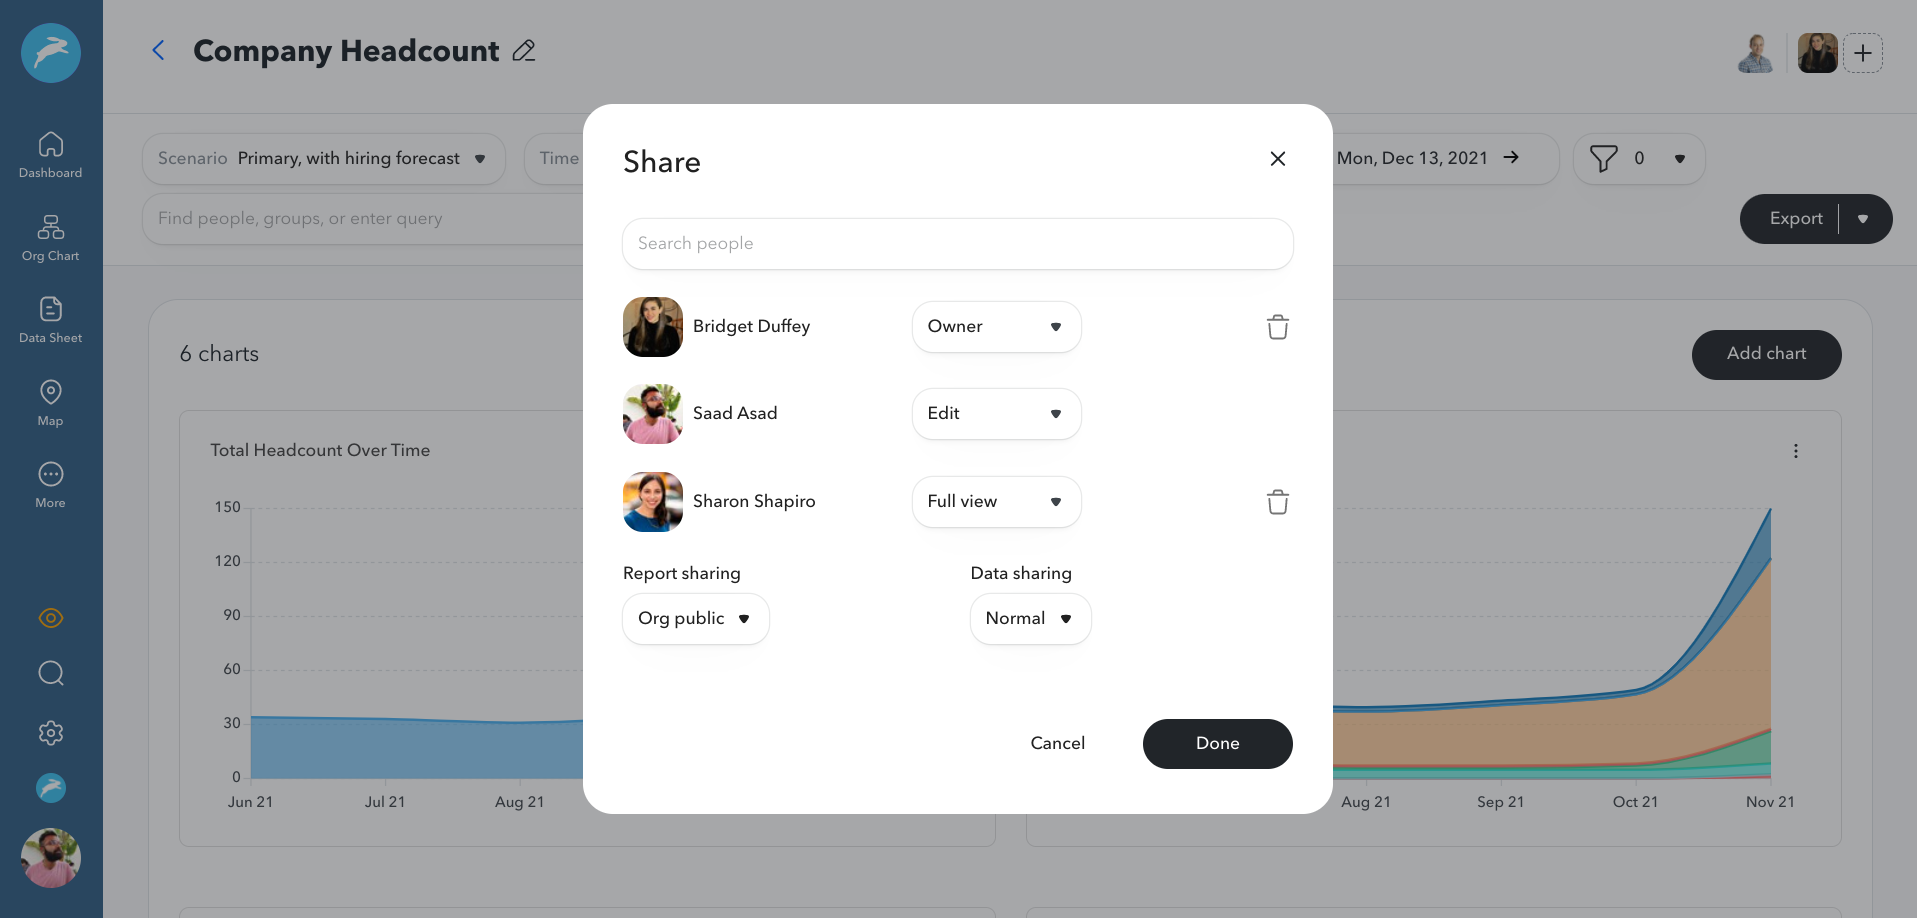
Control access to sensitive data
Use flexible access controls to permit who can see what data
Spend less time compiling spreadsheets and building reports
Aggregate data from all your people systems using ChartHop’s robust integrations with dozens of HR solutions. Slice and drill-down into data across dozens of filters with an intuitive report builder, or quickly capture insights with pre-built reports on gender and ethnicity breakdown -- all with the ability to analyze further by department, location, and more.
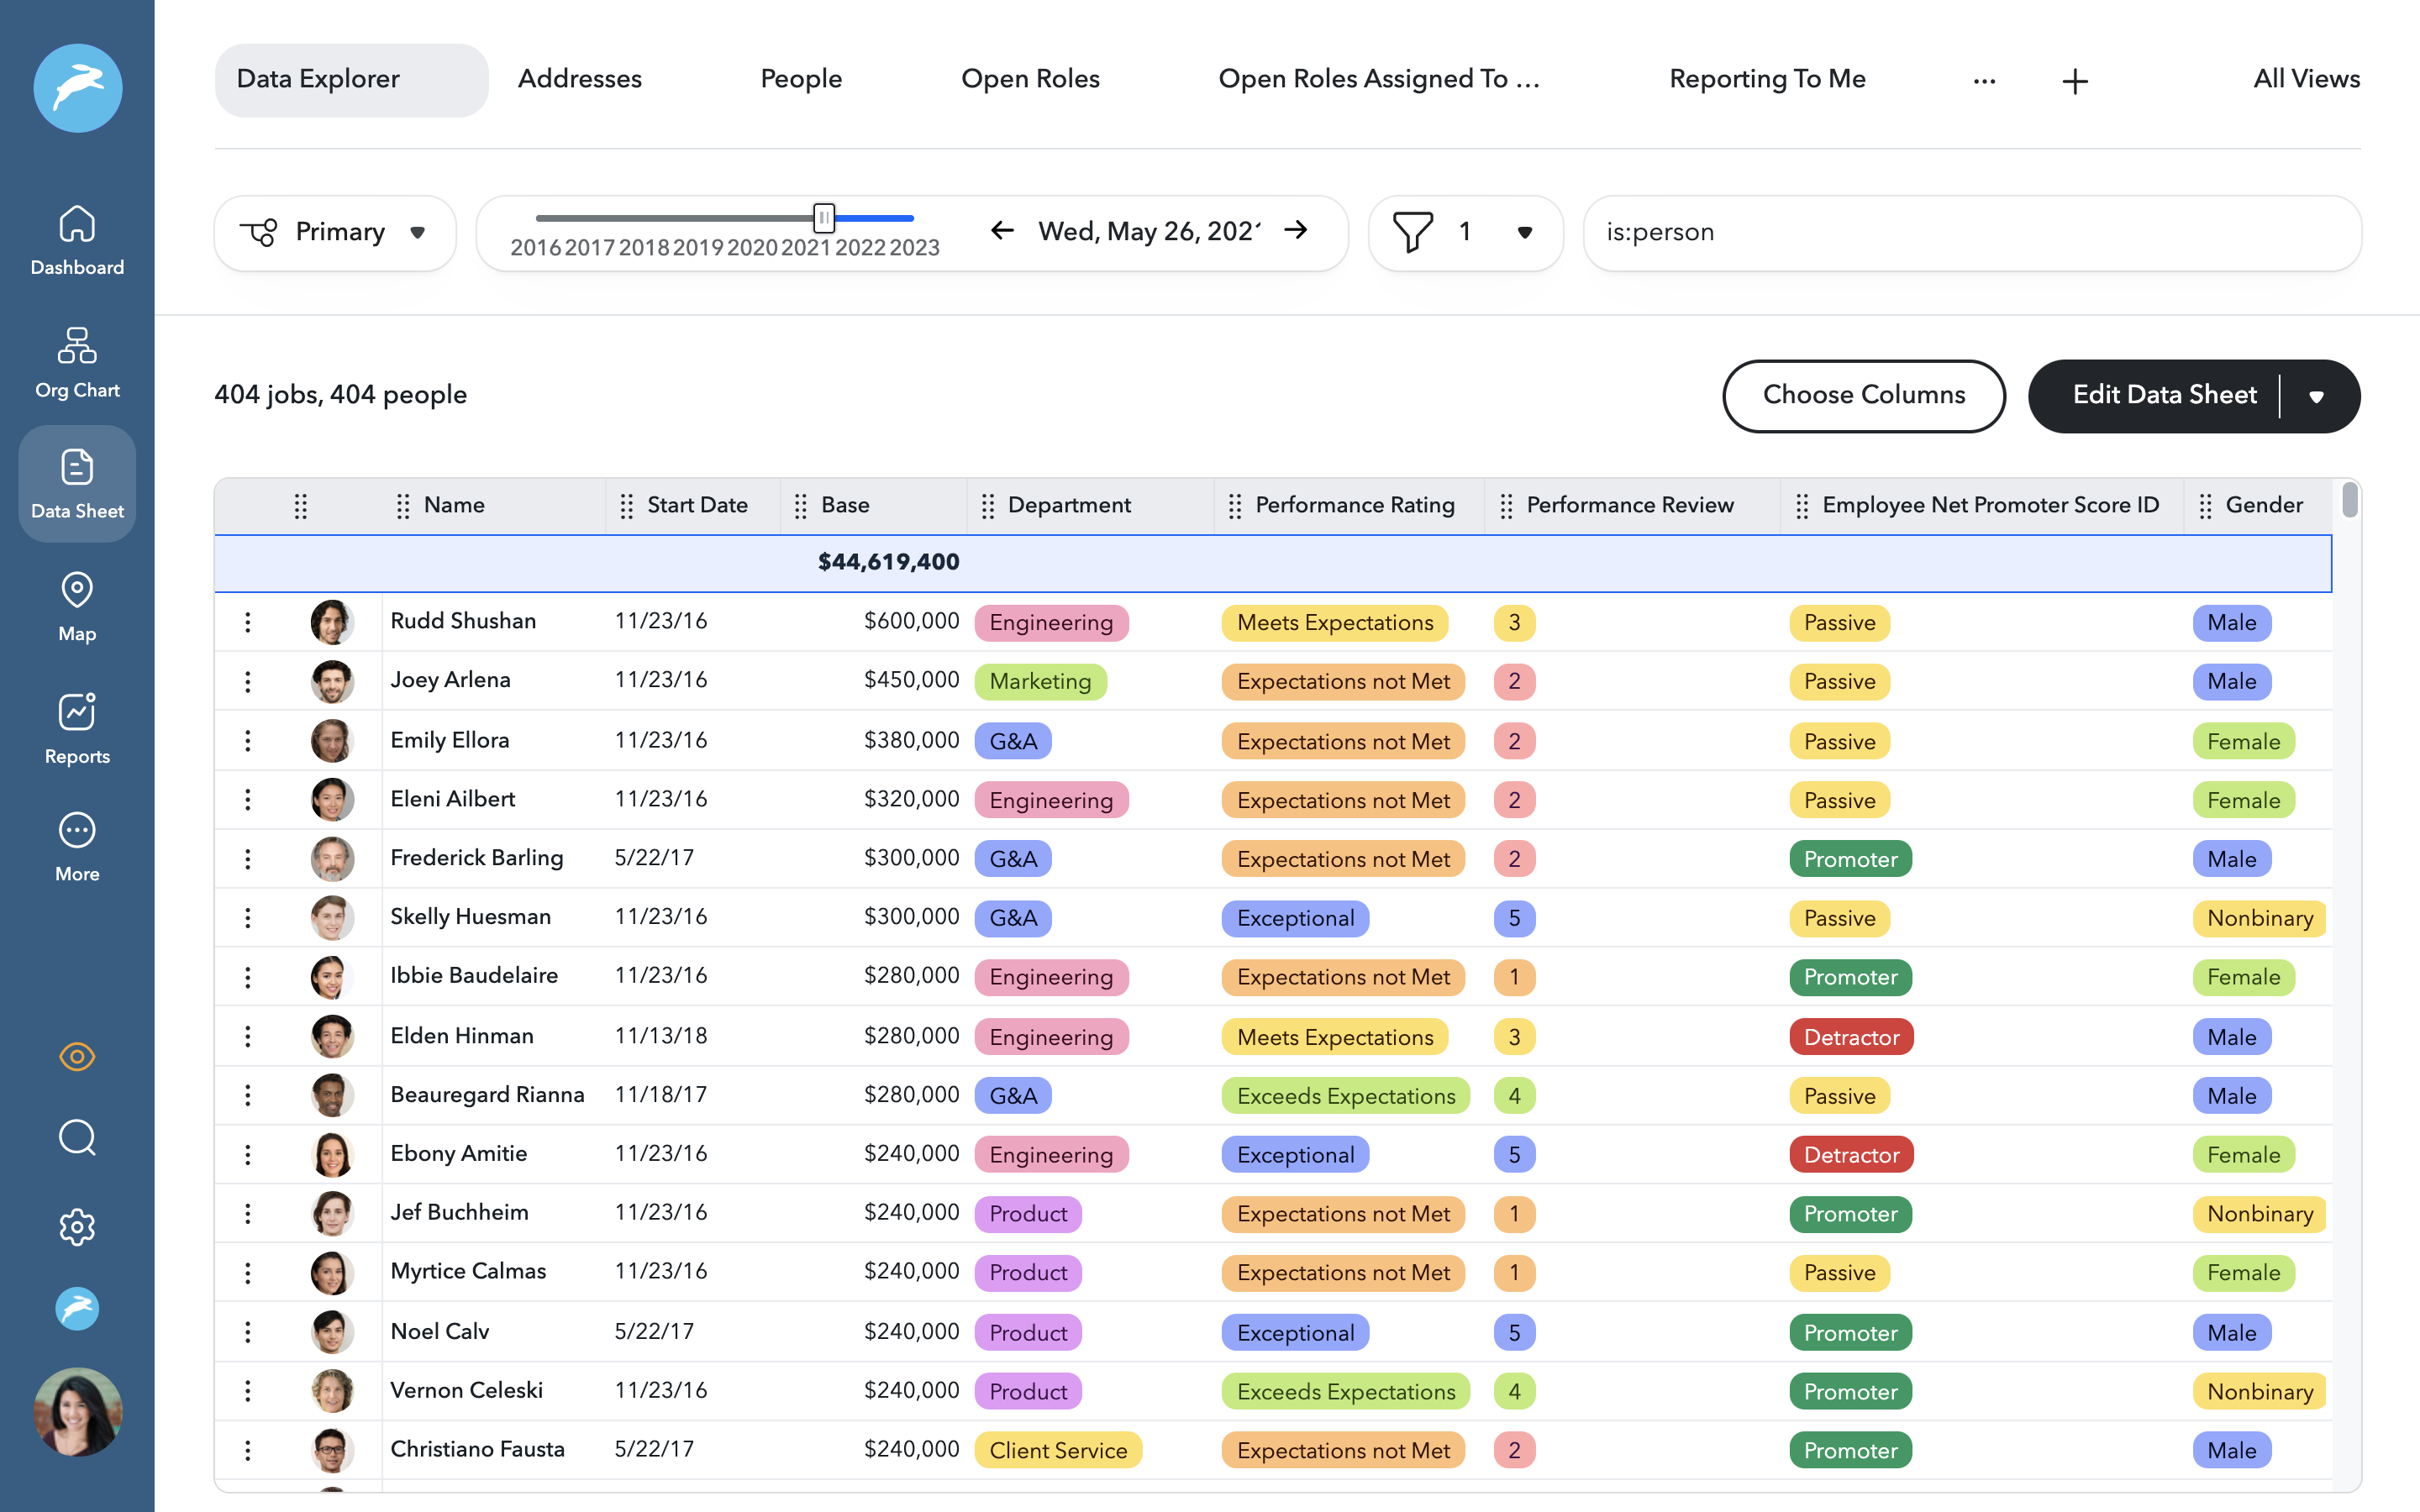
Uncover unique insights on your workforce by aggregating all your people data
Capture changes in people data over time such as compensation, span of control, performance rating, and more. Analyze metrics based on data from different systems, such as time-to-fill, tenure, and equity grants. Or calculate metrics such as flight risk or employee engagement scores.
Easily share reports with different access levels for different parts of the organization
Control access to data with multiple levels of sensitivity controls, whether it’s for executive-eyes only, managers, specific departments, or for the entire org to see. For presentations, easily export charts directly to PowerPoint.
All the tools you need for people analytics
Turnover, flight risk, performance, and more
Ethnicity, gender, education, and other demographic measures
Executive Dashboard
Data Explorer with configurable filters
Access-controlled Reports
Built to augment your existing tools.


& more
“Every time I pulled a report I had to double and triple check the data whereas now if I’m pulling it from ChartHop I just know it’s correct.”

ChartHop, Inc. has successfully completed a SOC 2 Type 2 examination by Schellman & Company.